

The Webtrends Reporting interface offers a modern experience for users wanting easy access to their data without the extra complexity of the traditional Analytics 9 interface. It complements your existing Analytics environment by providing an alternative means of viewing reports that is focused on the consumers of the Webtrends data.
Benefits
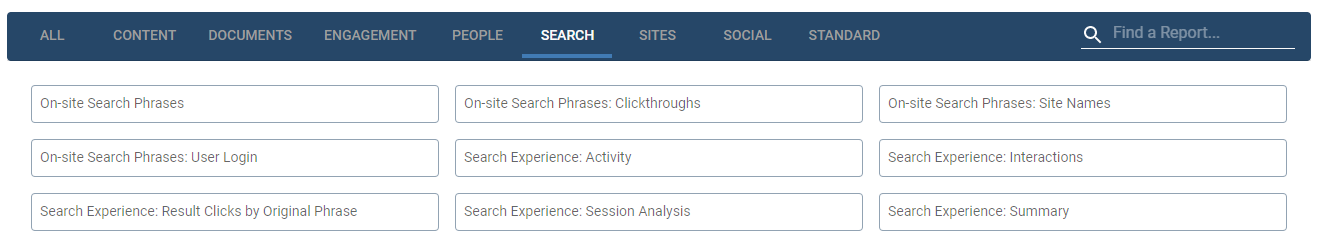
Easy Navigation - Simple and intuitive. Quickly find the metrics you need using a categorized report view with integrated search functionality.
Export Report Data - Save report data directly to your computer with no additional software required.
Modern Browser Support - Works in the latest versions of Chrome, Edge, Firefox, and Safari.
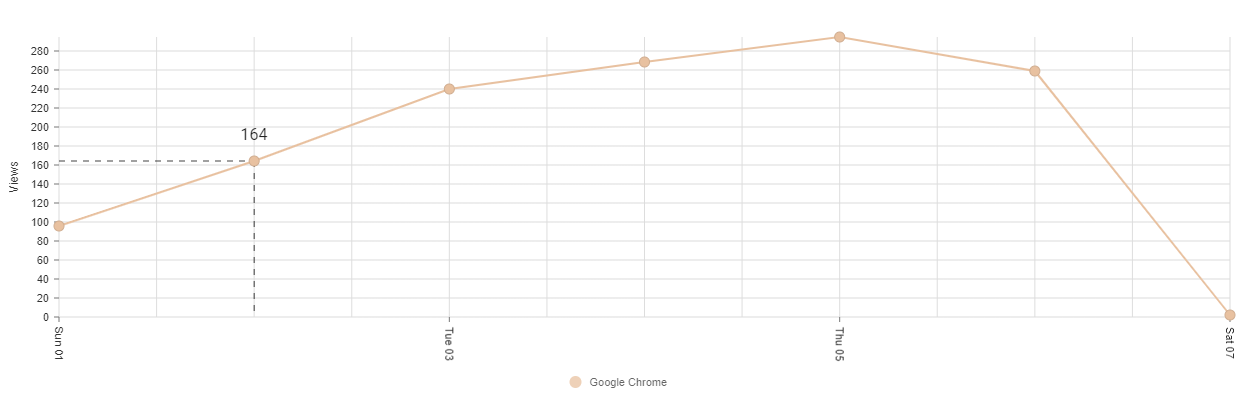
Interactive Trend Graphs - Get easy insights into your site's performance over time. Trends are available for all dimensions and measures.
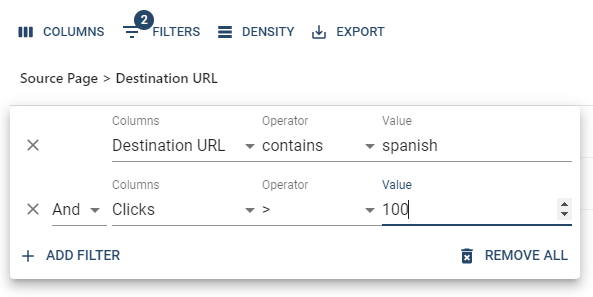
Improved Data Tables - Advanced search and filtering makes it easy to find relevant metrics. Sort, rearrange, and hide columns to focus on only the important data points.
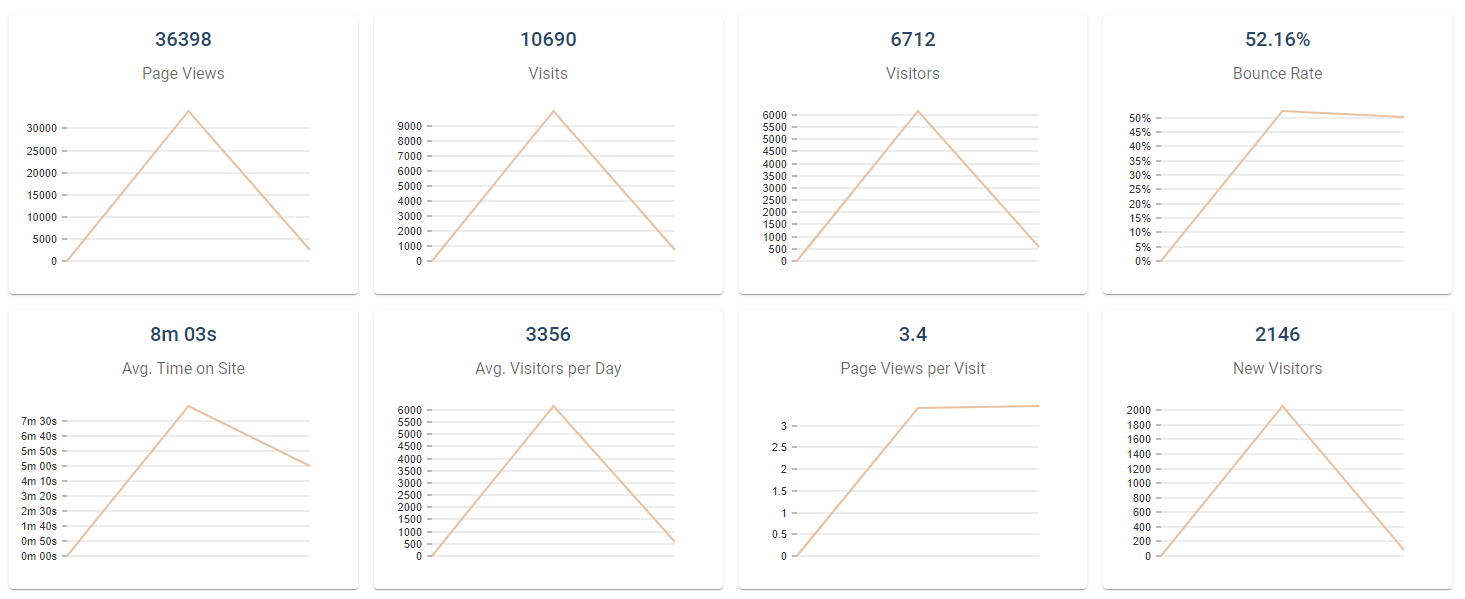
Key Metrics - Compare key metrics among your profiles in a single view. Understand site performance at a glance with the key metrics dashboard.
Shareable URLs - Easily share reports with colleagues by simply copying the URL from your browser.
Easy Deployment - Lightweight web application that can be deployed on any Windows server in minutes.
Webtrends Reporting vs. Analytics 9 User Interface
The Webtrends Reporting interface only provides access to report data. All administrative tasks including profile and report configuration, user management, and other application settings are performed in Analytics 9.