This article is designed to help you understand how Scenario Analysis can measure and improve visitor conversion on a web site. Using this information, you should be able to:
- Use Scenario Analysis to evaluate visitor conversion
- Create Scenarios specific to your web site
- Interpret Scenario Funnels
- Give your Webtrends administrator implementation instructions
Terms Used in this Article
This article uses some Webtrends-specific terminology that may be new to you.
Abandonment
The act of leaving a Web site immediately from a scenario without completing all the scenario steps during a visitor session. If a visitor leaves the scenario and re-enters it at any step during the same visit session, Webtrends does not consider this abandonment.
Conversion, Conversion Rate
The percentage of a group (of visits or visitors) that completed a specified action indicating customer interest. Conversion can assess any type of action a web site wants its visitors to perform, and any type of goal or mission a visitor wants to complete on the site. For example, conversion could describe the percentage of all visits that involved a completed registration. Conversion can also refer to visitors who performed a very small and precise action, such as reaching Step 3 of a scenario and then continuing to Step 4. It can also apply to a subpopulation, such as the percent of knowledge base searches that result in issue resolution.
Scenario
A series of two or more pages, or groups of pages, on a web site that can be treated as a process or logical sequence, such as the process of making a purchase (the checkout process), the process of signing up for a newsletter (the signup or registration process), the process of using a gift finder, and so on. While a scenario by definition has a series of ordered steps, it is possible for visitors to start processes mid-scenario, such as a campaign that directs visitors to Step 2 of the scenario.
Scenario Analysis
The settings in Webtrends that define the steps of your web site scenarios. Scenario Analysis provides the data for your Scenario Funnels. Scenario Analysis is set up by the Webtrends administrator. Scenario Analysis is a definitive and proven methodology that Webtrends delivers to customers to help them better understand and optimize conversion on their web site.
Scenario Conversion, Conversion Rate
The percentage of a group (of visits or visitors) that started a scenario in relation to those that completed the scenario.
Step Conversion Rate
The percentage of visits that reached a step specified in the scenario.
Scenario Entry Page, or Inflow
The page a visitor requested immediately before entering the scenario.
Scenario Exit Page, or Detours
The page a visitor requested immediately after completing or abandoning the scenario.
Scenario Funnel
A report showing the amount of activity at each step of a defined scenario, plus conversion rates for each transition from step to step as well as for the whole process. Examples of scenarios are check-out, registration, or application sequences. Scenario visualization capabilities show visitor progress through scenarios, as well as the origin of visits entering scenarios midway and where visitors went after leaving the scenario.
Step Transition
The path that visitors take through the scenario, including how they enter the scenario, which steps in the scenario they skip, and which steps they repeat before completing the scenario.
Webtrends Administrator
A Webtrends user who has rights to all features. The work needed to set up scenarios in Webtrends is completed by the Webtrends administrator.
What Is Scenario Analysis?
Every web site has a key goal or a series of key goals. For example, your web site's goal could be selling products, capturing leads, serving customers or simply getting visitors to an important destination page that holds some type of value. Measuring the success that visitors have in reaching that goal, is called measuring conversion. Given the seemingly thousands of navigation paths visitors can take through a Web site, it becomes difficult to analyze how well visitors click through your key pages to reach your end goal.
Webtrends Scenario Analysis is a unique approach to measuring how visitors interact with a defined conversion process. Using Scenario Analysis, you can measure:
- Inflow. All entry pages that lead visitors into the scenario including those that you don't define.
- Fall-out. Steps where your visitors leave the scenario.
- Detours. Pages that lead visitors out of the scenario.
- Abandonment. Number of visitors who leave the site immediately after participating in the scenario.
- Step Transitions. Show visitors who jump steps or retrace them, showing potential trouble spots in your conversion process.
- Webtrends provides unique analysis so that you have accurate and complete information on how your visitors interact with a conversion process.
How Can I Use Scenario Analysis?
Scenario Analysis can help you improve conversion rates on your web site by identifying key processes on your site and discovering how well the process works. For example, if one of your objectives is to increase the number of visitors who register on your site, your logical first step is to analyze the workflow in the registration areas of your web site. Scenario Analysis can help you isolate the important steps and collect detailed information about how visitors are using them, so you can discover how to drive visitors to complete the registration process.
If you create a 3-step registration scenario in Webtrends, Scenario Analysis can show you the top entry pages for each step in the scenario as well as the paths visitors take when they abandon or complete the registration process. Scenario reports show you how your visitors navigate each step in the registration process, where they get distracted or give up, and what pages they visit after they leave the scenario. The size of the funnel between each step provides a visual overview of how many visitors successfully move through each scenario step.
By understanding where visitors fell out of the process you've set out for them, and what they do instead of completing the scenario, you can start to optimize your site's pages and improve the conversion numbers you see for each individual scenario step.
Working with the Scenario Analysis Sample
To look at a sample Scenario Funnel, install Webtrends sample data. Looking at sample data can help you understand the examples provided later in this document and provide ideas for designing your own scenarios.
Webtrends Analytics Software Sample Data
If you have not already done so, install the sample data.
To install the sample:
- Log in to the Webtrends Analytics.
- In the left pane, click Administration > Install Components.
- Click Sample Downloads.
- Click the Zedesco Sample.
- Click Save.
- Install the sample.
Webtrends Analytics On Demand Sample Data
Webtrends Analytics On Demand provides a site where you can view sample Scenario Analysis settings and Scenario Conversion Funnels.
To request access to this site, contact a Webtrends Sales Representative.
Understanding a Sample Scenario Funnel
One type of Scenario Analysis is the Purchase Conversion Funnel.
To see the sample Purchase Conversion Funnel:
- In the left pane, click Administration > Web Analysis > Reports & Profiles.
- Click the name of the sample: Zedesco profile. Webtrends Analytics Reports opens, showing the sample report.
- In the Table of Contents, click Scenario Analysis > Purchase Conversion Funnel. The Entry/Exit Pages view of the funnel is displayed in the right pane.
The following graphic shows the sample Purchase Conversion Funnel and describes each part of the graph.
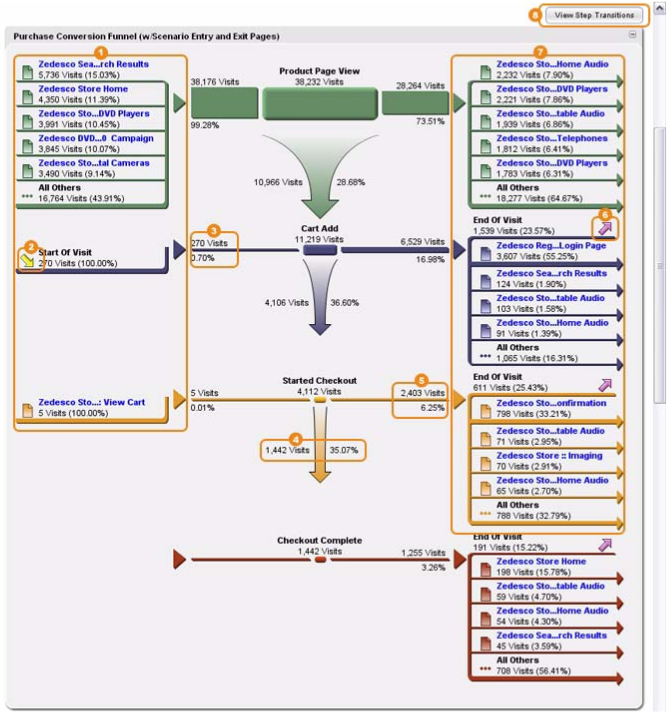
The following table explains the callouts in the preceding graphic.
| Callout | Description |
|---|---|
| 1 | Shows the flow of visitors into the scenario and at which step they entered the scenario. |
| 2 | Shows visitors who started their visits at this step. |
| 3 | Shows visitors who entered at Step 2. |
| 4 | Shows visitors who went directly from Step 3 to Step 4. |
| 5 | Shows visitors who abandoned at Step 3. |
| 6 | Shows visitors who abandoned the site at this step. |
| 7 | Shows the detours that led the visitor away from the scenario. |
| 8 | Shows movement from step to step. |
Using the Purchase Conversion Funnel, you can see the flow of visitors into the scenario. Notice that the Funnel shows you entry points for each step you have defined. The number of visits for each of these entry pages suggests which pages encourage visitors to enter the scenario most effectively. You see in the sample Funnel that most visitors enter the scenario at Step 1, accounting for 4,300 visits. You can also see that visitors dropped out of the scenario in successively smaller numbers at each step, which is desirable. In Step 1, 2,825 visits dropped out of the scenario; in Step 2, 1,752 visits dropped out of the scenario; and in Step 3, 375 dropped out of the scenario.
You could also look at the pages that led visitors out of the scenario. The pages on the right side of the Funnel show the detours that visitors took rather than completing the scenario. The top detour pages for Step 2 were the Log in page, Search Results, View Cart, and Support. If this were your actual scenario, you should consider meeting with your web designer and a usability expert to see what you can do to reduce the number of detours.
You should also look at the abandonment rate for each step, which you can view by looking at the End of Visit values in the right side of the Funnel. The End of Visit value for Step 2 was 521 visits. This value tells you that not only did 521 visits fall out of the scenario at this step, but also that they abandoned your site. Unless the End of Visit occurs in the last step, this is likely cause for concern.
When looking at this sample Funnel as a whole, you might be concerned that 58.14% of visitors who started the scenario fell out of the scenario at Step 1. If this were your actual purchase Funnel, you'd want to look into Step 1 to see how you could improve the conversion from Step 1 to Step 2.
Click View Step Transitions to display an alternate view of the Scenario Funnel in the right pane, as shown in the following graphic:
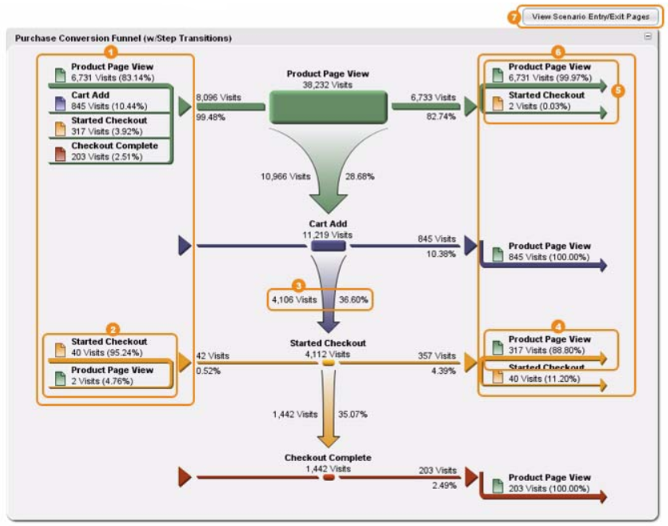
The following table explains the callouts in the preceding graphic.
| Callout | Description |
|---|---|
| 1 | Shows how visitors entered each step. |
| 2 | Shows that one visitor entered directly at Step 2. |
| 3 | Shows visitors who went directly from Step 2 to Step 3. |
| 4 | Shows visitors retracing their steps. |
| 5 | Shows that six visitors went from Step 1 to Step 3, skipping Step 2. |
| 6 | Shows the next step visitors went to. |
| 7 | Shows how visitors started and abandoned the Scenario. |
This view of the sample Funnel shows that visitors commonly return to the Product Page View, which is typical behavior in a purchase scenario and desirable when they continue to add products to their shopping carts. What you want to look out for in this view are those visitors who seem to be confused and retrace their steps in an effort to understand the process your web site is asking them to complete. However, if you identify a step that visitors are repeating when you cannot explain the behavior, you should make it a priority to find out why.
Both the Entry/Exit Pages view and the Step Transitions view are explained in more detail later in this article. For more information, see “Scenario Funnel Examples,” below.
Designing Scenario Funnels to Improve Conversion
You probably have a scenario in mind that you'd like to analyze using a Conversion Funnel. The following questions should help you get started:
- What is the sequence of steps in your scenario?
- Which steps are crucial to understanding visitor behavior?
- Which parts of the process can be excluded from the scenario? There may be parts of the process that the visitor is required to complete but that do not give you any insight in measuring conversion. Leave these steps out of the scenario.
The following section describes how each step can be used to improve scenario conversion rates.
Purchase Conversion Funnel
For commercial web sites that offer goods and services, the most common scenarios measure how many customers complete a purchase. Typically, purchase conversion scenarios measure the rates at which customers finish the checkout process.
The following steps are essential for creating a Purchase Conversion Funnel:
- View Product Page
- Add Product to Cart
- Start Checkout
- Complete Checkout
Alternatively, you could define Step 1 as your Home page to get more information about entry points to the scenario. You could also include other steps to your Purchase Conversion Funnel such as “View Shipping Information” or “Submit Payment Information.”
Customer Service Conversion Funnel
If your web site provides customer service such as technical support, you may need to measure how easily visitors can find the information they need. Each step provides important information that you can use to reduce trouble spots in your Customer Service site.
The following steps are essential to understanding whether the Customer Service site answered your visitors’ questions:
- Select Product
- Search Topics
- View Results
- Submit Successful Issue Resolution
Registration Conversion Funnel
You can track how successfully your site convinces visitors to register and identify problems in the registration process using a Registration Funnel.
Modify these steps to match your registration process:
- Start Information Request
- Verified Contact Information
- Completed Registration
Email Open Conversion Funnel
If you send sales or marketing materials to customers or prospects using email, you probably want to know how many customers are reading your email messages, how effective your email campaign was at driving traffic to your web site, and how many customers moved directly from reading the email to completing a transaction on the site. You can track response rates for campaigns using an Email Conversion Funnel.
For a commerce site, an Email conversion scenario includes the following steps:
- Email Open
- Clickthrough
- Product Page View
- Cart Add
- Started Checkout
- Checkout Complete
Modify the steps in the scenario to match your campaign's call to action. For example, if you are primarily interested in email open rates and high-level conversion rates, you can eliminate Steps 4 and 5.
Scenario Design Worksheet
You can use the following worksheet to put your design ideas on paper. After you complete it, give it to your Webtrends administrator or use it as a guide while you set up the scenario in Webtrends Analytics.
Scenario |
Notes |
|---|---|
How do you want the Name of your scenario to appear in reports? |
|
Give your scenario a Report Title to help identify it when it is one of many reports listed in a template. |
|
Briefly describe the purpose of the scenario. For example, “This scenario shows how successfully visitors feel their issues are resolved when using the Support site.” Administrators, type this information in the Short Description text box. |
|
What other details should your report users know about this scenario? This information is displayed in the Help card for the scenario report. |
|
| Step 1 | |
What is the name of the first step in the scenario? |
|
What should report users know about Step 1? This information will be included in the Help Card for this step. |
|
| Step 2 | |
What is the name of the second step in the scenario? |
|
What should report users know about Step 2? This information will be included in the Help Card for this step. |
|
| Step 3 | |
What is the name of the third step in the scenario? |
|
What should users know about Step 3? This will appear in the Help Card for this step. |
|
| Step 4 | |
What is the name of the fourth step in the scenario? |
|
What should reports users know about Step 4? This information will be included in the Help Card for this step. |
Resources for Configuring Scenario Analysis
After you complete the Scenario Design Worksheet, you or your Webtrends administrator can set your scenario up in Webtrends Analytics.
For information about setting up Webtrends Scenario Analysis for Webtrends Analytics reports, see “Configuring Scenario Analysis Using SmartSource Tags" and “Configuring Scenario Analysis By Specifying URLs,” below.
Scenario Funnel Examples
Because Scenario Funnels provide a great deal of information in a single graphic, this section provides a set of examples that can help you understand how Scenario Funnels illustrate visitor behavior. In these examples, we will look at a scenario configured for the Support section of a web site. Let's assume that the purpose for creating this scenario is to discover how effectively the Help section of the Support site answers visitor's questions. In cases where the Help section was not effective, we want to know the page from which visitors left to find answers.
The following scenario steps and URLs are used in examples:
Step 1 - Select Product
/support/selectproduct.aspx
Step 2 - Search Topics
/support/searchtopics.aspx
Step 3 - View Result
/support/viewresult.aspx
Step 4 - Issue Resolved
/support/issueresolved.aspx
Simple Funnel Example
For this example, imagine that two visitors go to your web site's support section, one from computer.cnc.com and one from abc.ister.com. The first visitor completes Step 1 and 2 of your scenario and then abandons, while the other visitor completes Step 1 through 4 of the scenario. This activity results in two visitors and two visits, for seven total page views. The following table shows the activity for each visitor.
| computer.cnc.com | abc.ister.com |
|---|---|
| /support/selectproduct.aspx | /support/selectproduct.aspx |
| /support/searchtopics.aspx | /support/searchtopics.aspx |
| /support/exitsiteaftersearchtopics.aspx/support/viewresult.aspx | /support/issueresolved.aspx |
The italicized URL is not part of the scenario and is not displayed in the Scenario Funnel.
The following graphic shows a Scenario Funnel describing the two visitors in this example:
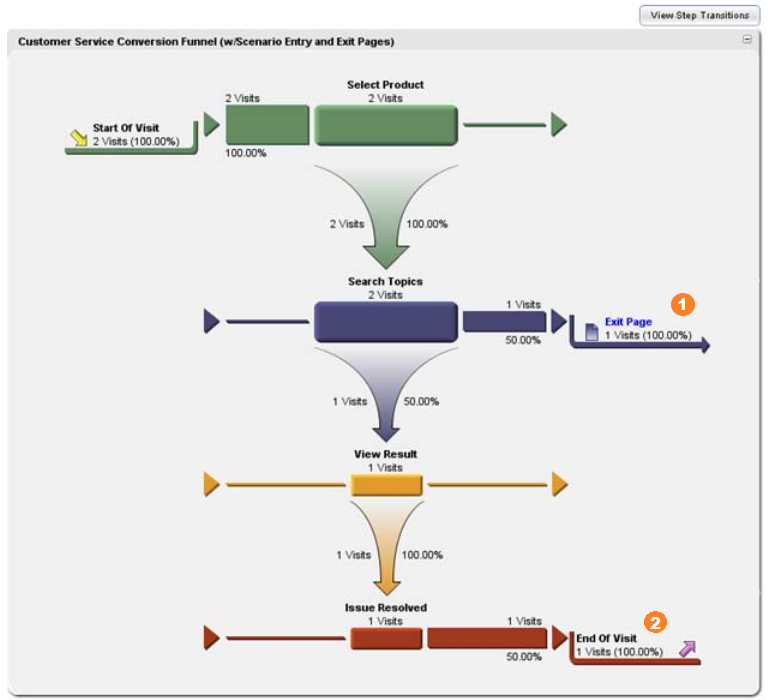
- Visitor from computer.cnc.com left the site and did not complete the Scenario. If visitors regularly abandoned here, you would want to analyze this step.
- Visitor from abc.ister.com completed every step of the Scenario and exited.
If you click View Step Transitions at the top of the report, the alternate view of the Scenario Funnel opens, showing how visitors moved through the scenario, as shown in the following graphic. Notice that in this example each visitor moved from one step to the next in the correct direction, without returning to any previous steps.
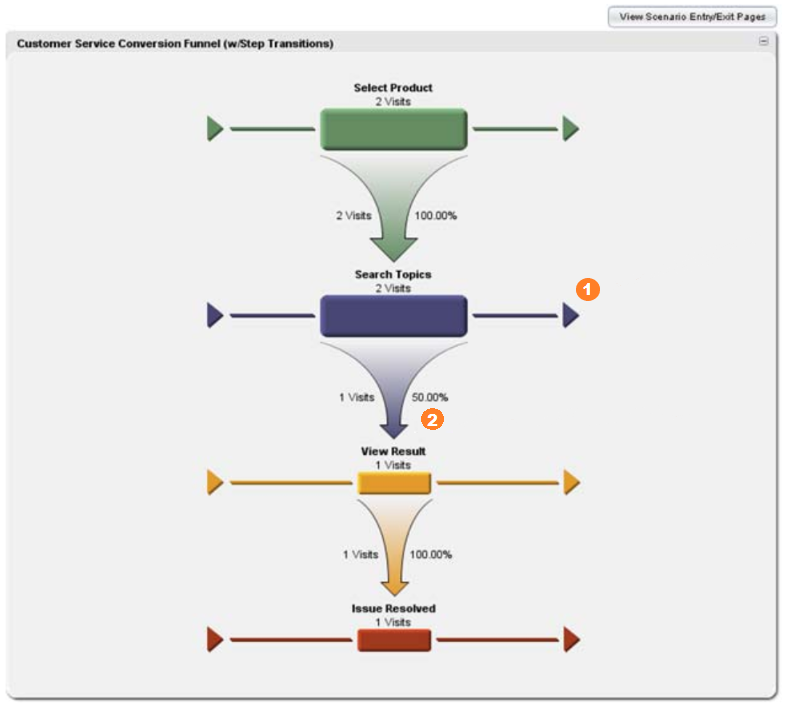
- Notice that you do not see the Exit page at the Search Topics Step. The Step Transition view of the Funnel only shows movement within the Scenario. Pages that are not part of the Scenario are not displayed here.
- The number of visits drops off after Step 2, indicating where the second visitor abandoned the Scenario.
Advanced Example: Visitors Repeating Steps
Imagine that the two visitors from our previous example visited the Support section of your site. In this example, the visitors visited pages that are not included in the scenario. They also returned to an earlier step after completing the step. In this example:
Visitor from computer.cnc.com
- Completed Steps 1 and 2 of your scenario
- Went to a page that is not part of your scenario
- Returned to Step 1 and finally completes all scenario steps
Visitor from abc.ister.com
- Completed Steps 1-3 of your scenario
- Went back to Step 2
- Continued to Step 3
- Went to a page that is not part of scenario (shippingterms.aspx)
- Completed Steps 3 and 4
The result of this activity is two visitors, two visits, and 15 page views, as shown in the following table.
| computer.cnc.com | abc.ister.com |
|---|---|
| /support/selectproduct.aspx | /support/selectproduct.aspx |
| /support/searchtopics.aspx | /support/searchtopics.aspx |
| /support/exitsiteaftersearchtopics.aspx | /support/viewresult.aspx |
| /support/selectproduct.aspx | /support/searchtopics.aspx |
| /support/searchtopics.aspx | /support/viewresult.aspx |
| /support/viewresult.aspx | /support/shippingterms.aspx |
| /support/issueresolved.aspx | /support/issueresolved.aspx |
Because the italicized URLs are not part of the scenario, the Scenario Funnel does not show them.
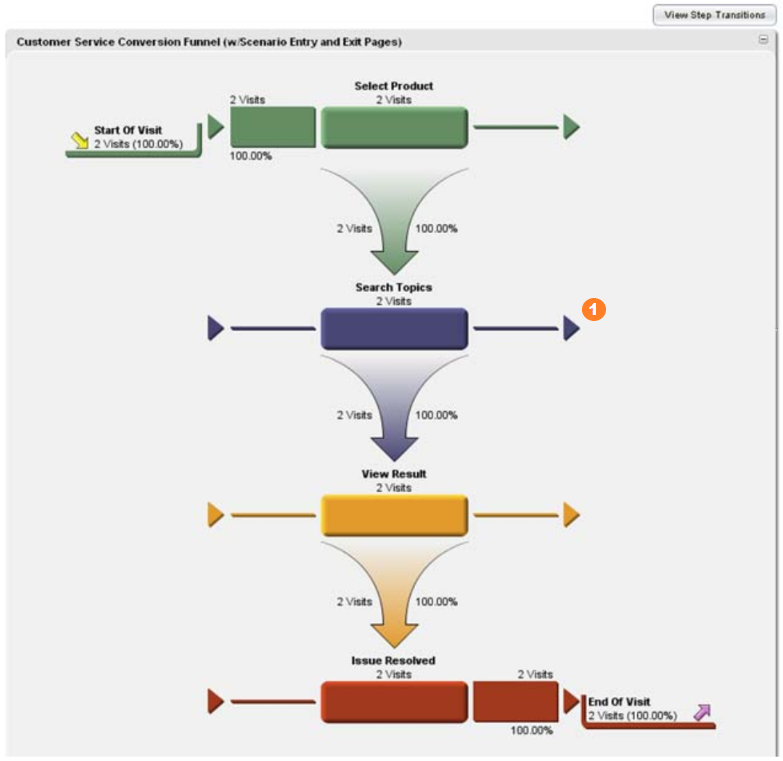
The following graphic shows the Scenario Funnel describing these two visitors:
-
This report only shows exit pages if visitors did not return to any of the Scenario step pages during the visit.
Because the visitors completed each step in the Scenario, there are 2 visits for every step even though the page visits did not occur in the order you see here.
In the next example you'll see what the Scenario Funnel looks like when a visitor did not complete every step before leaving the site.
If you click View Step Transitions at the top of the report, an alternate view of the Scenario Funnel opens, as shown in the following graphic:
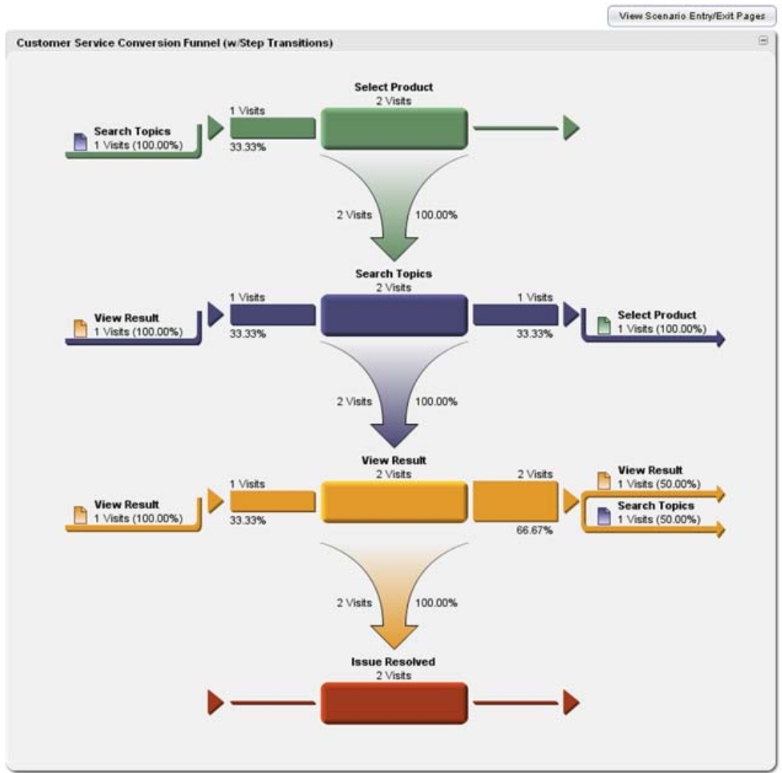
Because this version of the report only shows movement within the Scenario, the shippingterms.aspx and exitsiteaftersearchtopics.aspx pages are not displayed. This makes it appear that the visitor left the View Result Step and went to back to Step 3 (View Result). The actual sequence was:
Multiple Exit Example
In this example, four visitors came to your Support site. Some of these visitors bounced between steps, and those visitors who abandoned the scenario did so at different exit pages. In this example:
Visitor from computer.cnc.com
- Completed scenario steps 1-3
- Abandoned the scenario at Step 3
Visitor from abc.ister.com
- Entered the scenario at Step 2
- Bounced between Steps 2 and 3
- Viewed a page outside of the scenario
- Completed the scenario
Visitor from net.online.com
- Entered the scenario at Step 2
- Went to Step 2
- Exited the scenario at Step 2
Visitor from system.foxlink.net
- Entered the scenario at Step 3
- Completed Steps 1-4
The result of this activity is four visitors, four visits, and 20 page views, as shown in the following table.
| computer.cnc.com | abc.ister.com | net.online.com | system.foxlink.net |
|---|---|---|---|
| /support/selectproduct.aspx | /products/detail.aspx | /company/about.aspx | /products/detail.aspx |
| /support/searchtopics.aspx | /support/searchtopics.aspx | /support/searchtopics.aspx | /support/viewresult.aspx |
| /support/viewresult.aspx | /support/viewresult.aspx | /lastpageviewed.aspx | /support/selectproduct.aspx |
| /support/exitsiteafterviewresult.aspx | /support/searchtopics.aspx | /support/searchtopics.aspx | /support/viewresult.aspx |
| /support/shippingterms.aspx | /support/issueresolved.aspx | ||
| /support/issueresolved.aspx |
The italicized URLs highlighted are not part of the scenario.
The following graphic shows Scenario Funnel for these four visitors:
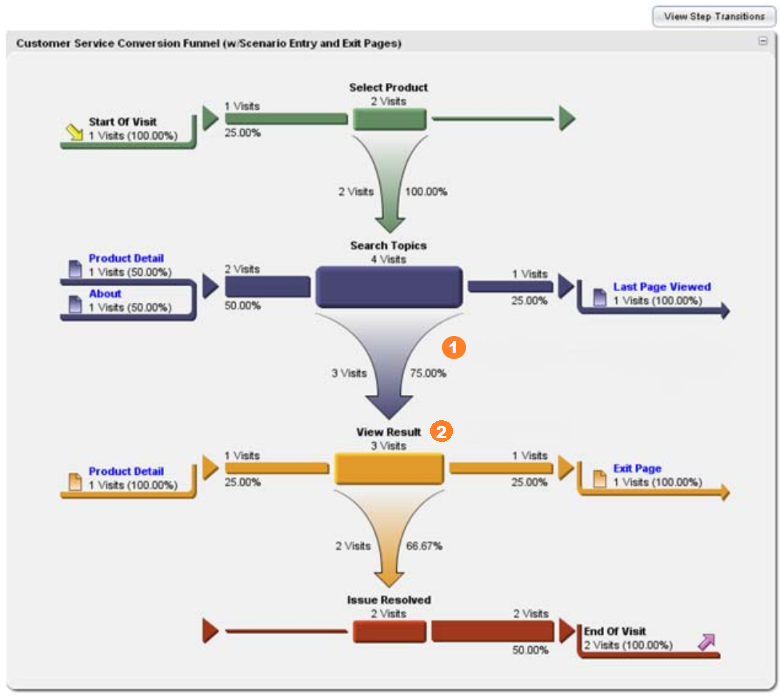
- Of the 2 visitors who entered directly at Step 2 and the 4 visitors who entered from Step 1, only 3 visitors continued to Step 3.
- Of the 2 visitors who entered directly at Step 2 and the 4 visitors who entered from Step 1, only 3 visitors continued to Step 3.
Notice that the shippingterms.aspx page is not displayed as an exit page because the visitor from abc.ister.com reentered the scenario during the visitor session.
If you click View Step Transitions at the top of the report, an alternate view of the Scenario Funnel is shown. This view of the report only shows movement between steps within the scenario. It does not show pages that are not part of the scenario.
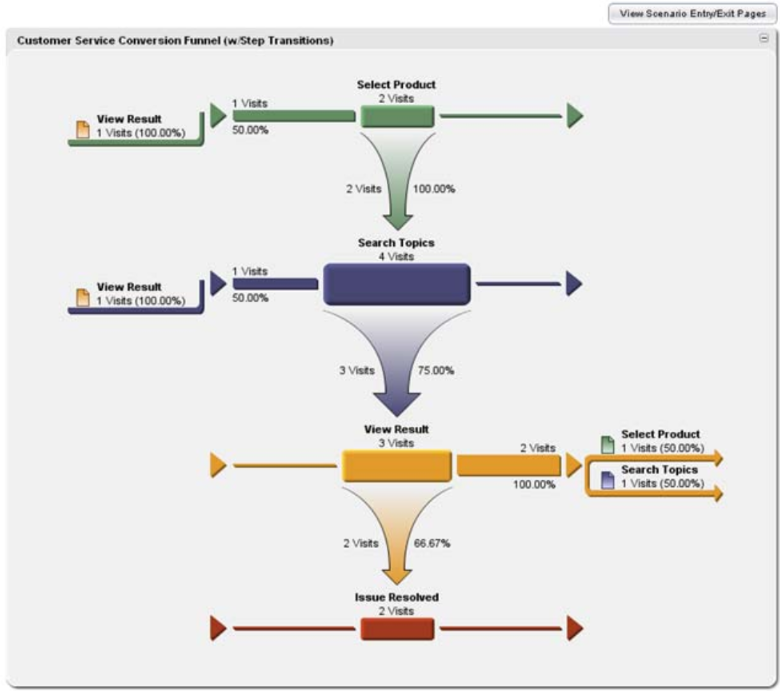
Look at the exit paths for the View Result page in the following graphic. One visitor entered the scenario at Step 3 and went directly back to Step 1. Another visitor entered at Step 1 but then went back and forth between Steps 2 and 3.
Interpreting Scenario Funnels
This article provides answers to some common questions about interpreting Scenario Analysis results.
What Can a Funnel Tell Me About My Scenario?
Your Scenario Funnel can answer these questions:
-
Where did visitors enter the scenario? A Scenario Funnel shows not only the visitors who entered at Step 1, but also how visitors entered each step. You can identify the pages that led visitors to your scenario, such as marketing program pages, product pages, and customer loyalty pages.
-
Where in the process did visitors abandon the scenario? A Scenario Funnel shows abandonment for each step.
-
Did visitors skip steps in the scenario? The Step Transitions Funnel view shows whether visitors completed each step in the process consecutively, if they skipped steps, or if they went back and forth between steps. This view may identify unnecessary steps, steps that were not completed correctly, or confusing steps which caused visitors to backtrack through the process.
-
Where did visitors go when they left the scenario? A Scenario Funnel shows whether visitors left the site immediately after leaving the scenario, were distracted by a product or service that you cross-sell, or needed more information before completing the process.
Why Are Visits for Step X Higher Than for a Preceding Step?
You may wonder why your Scenario Funnel does not taper perfectly, showing more visits for a step later in the scenario than for a preceding step. There are a number of possibilities. One reason is that visitors can enter the scenario at any step in the process. A visitor may have bookmarked Step 2 in a previous visit and then entered the scenario using the bookmark when returning.
Another reason is that the visitor session may have ended when the visitor was completing Step 2. When the visitor resumed activity, a new visitor session began, and the results show that the visitor entered the scenario at Step 2. In both cases, the Scenario Funnel could show more visits for Step 2 than for Step 1.
Why Don't These Numbers Add Up?
When you look at an Entry/Exit Pages Funnel, you may mentally add the total of the visits where visitors abandoned a step to the visits where visitors continued to the next step, and wonder why these numbers don't add up to the number of visits coming into the step in question.
For example, suppose you have a Funnel that shows 11 visits for Step 2. In two of those visits, the visitor abandoned the scenario, and eight visits were converted to Step 3. You can add those visits together to account for 10 of the 11 visits, but you may wonder what happened to the remaining visit. However, if you switch the Funnel to the Scenario Step Transitions view and look at the exit pages for Step 2, you might see that one visitor skipped Step 3 and went directly to Step 4. Although the Step Transitions View shows the same number of visits for Step 2, your analysis of the pages visited immediately after Step 2 could help you account for the missing visit.
Why Are Numbers of Visits Different from View to View?
You can look at the Scenario Funnel using two views of the Scenario Funnel graph: Scenario Entry/Exit Pages and Scenario Step Transitions. The Entry/Exit Pages view shows the entry and exit pages for each step in the scenario, and the Step Transitions view shows how visitors move from step-to-step in the scenario. While it might be tempting to sum the visits in each view in an effort to reconcile them, because of the non-linear nature of scenarios, you may not be able to do so. Instead, if you want a summary of visits for the scenario, use the table view of the Scenario Funnel.
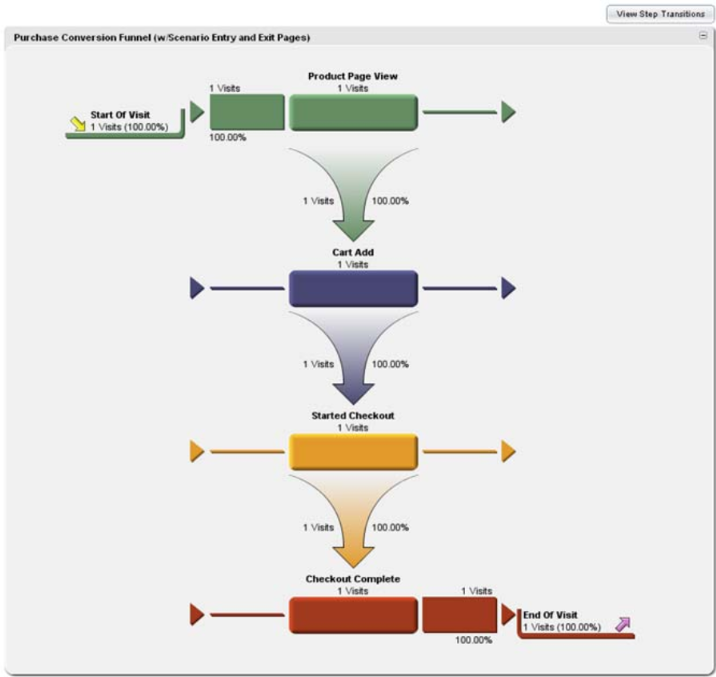
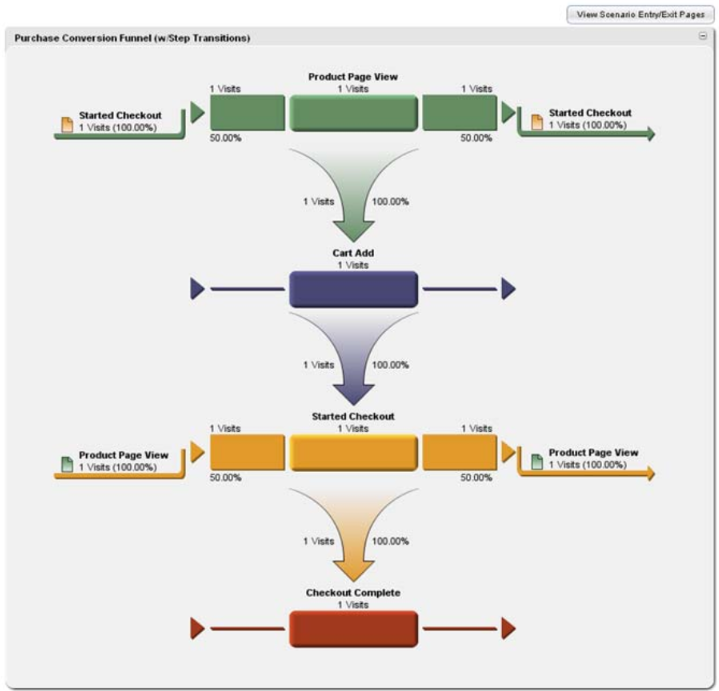
To understand the different views, consider this example in which one visitor enters the scenario and moves through the steps in the following order:
- Step 1 - Product Page View
- Step 2 - Cart Add
- Step 3 - Started Checkout
- Step 1 - Product Page View
- Step 3 - Started Checkout
- Step 4 - Checkout Complete
The following graphic shows the Entry/Exit Pages view for this simple example. Notice that when the visitor returns to Step 1, the step is included in the same visitor session and thus is not counted as a second visit:
The following graphic shows the Step Transitions view of the same simple 1-visit example. In this view, you can see that the visitor went back to Step 1 and then from Step 1 to Step 3:
The following graphic shows the data in tabular form, which provides the visits and conversion rates for each step and for the scenario as a whole:

Configuring Scenario Analysis
You can configure Scenario Analysis either by specifying URLs associated with the scenario or using SmartSource tags.
If you use Webtrends software without SmartSource Data Collector, you will define each step by specifying the URL that identifies it. If your web site content is generated dynamically, you also specify the parameters associated with the page requests. For more information, see “Configuring Scenario Analysis By Specifying URLs,” below.
If you are using Webtrends On Demand or Webtrends software with SmartSource Data Collector, you will create a Scenario Analysis definition that specifies the details of the SmartSource tags you plan to use in your web pages. Using this method, you need not specify the URLs of the pages. For more information, see “Configuring Scenario Analysis Using SmartSource Tags,” below.
Configuring Scenario Analysis Using SmartSource Tags
If you are using Webtrends On Demand or Webtrends software with SmartSource Data Collector, you will create a Scenario Analysis definition that specifies the details of the SmartSource tags you plan to use to collect Scenario data on your site. You will place the SmartSource tags on each page of a step that you want to track. These tags indicate the Scenario Analysis name and include information about either the step name or the step number.
Creating Scenario Analysis Definitions Using SmartSource Tags
To create a Scenario Analysis definition:
-
In the left pane, click Administration > Web Analysis > Report Configuration > Scenario Analysis.
-
Click New.
-
In the Name text box, type the name to identify this Scenario in Webtrends Administration.
-
Type the value of the
WT.si_nparameter in the SmartSource Identification String text box. Webtrends associates web pages having this value with this Scenario Analysis definition. -
Type an informative description for report users in the Short Description text box.
-
Provide explanatory information for users in the Help Card text box. This information is included in the Help Card section of the report.
-
Select the Use SmartSource tags exclusively check box.
- If you use the
WT.si_xparameter to identify steps, select Position (using WT.si_x). - If you use the
WT.si_pparameter to identify steps, select Name (using WT.si_p).
- If you use the
-
Configure each step you want to track. For more information see “Creating Scenario Steps Using SmartSource Tags,” below.
-
Use the arrows in the Ordered List of Steps list to arrange the steps in the correct order for this Scenario.
-
Click Save.
Creating Scenario Steps Using SmartSource Tags
To configure Scenario steps:
-
In the Scenario Analysis Step dialog, type a name to identify the step in the Name text box. Webtrends Analytics does not use this setting during analysis, but it gives you a way to identify the step in Webtrends Administration.
-
In the SmartSource Identification String text box, type the Webtrends query parameter that identifies the step. Use one of the following methods to identify the step:
- If you want to identify the step by name, tag your Web pages with the
WT.si_pparameter, and type the value of theWT.si_pparameter in the SmartSource Identification String text box. For example, if you will tag your Web page for this stepWT.si_p=CartView, typeCartViewhere. - If you want to identify the step by number, what you specify here is for your purposes only. Webtrends does not use the SmartSource Identification String setting for steps specified with the
WT.si_xparameter. You will tag your pages with theWT.si_xparameter, and that value is used to specify the numeric position of the step. After you configure all the steps for this scenario, arrange the steps in the Ordered List of Steps list box to match each step’s position.
- If you want to identify the step by name, tag your Web pages with the
-
In the Report Name text box, type a name that identifies the step in reports.
-
In the Description (Help Card) text box, provide explanatory information for this step. This information is included in the Help Card section of the report.
-
Click Next.
-
If you selected the Use SmartSource tags exclusively check box, leave the settings in the When to Measure dialog blank.
-
Otherwise, type the URL of the page to track for this step in the Page Expression text box. Webtrends looks for SmartSource tag data, and if there is none, it identifies scenario data using the URLs you specify in your Scenario Analysis definition.
-
If you want to treat the Page Expression text box as a regular expression, select the Regular Expression check box. Otherwise, leave the check box unselected.
-
If your site content is delivered using dynamic pages, click New to specify the parameters that define this step.
-
Click Save.
Preparing Your Web Site for Scenario Analysis
After you create the Scenario Analysis definition, tag the pages you want to track for this scenario using query parameters described in this section.
WT.si_n
Identifies the name of the scenario. The maximum length for each name value is 64 characters. The value of this parameter must match the Scenario Analysis Name setting. You can tag a page for multiple scenarios by separating multiple values with a semicolon.
Choose which method you want to use to identify steps in the scenario. You can use only one of the following query parameters to identify the step:
-
Step name
Use the
WT.si_pparameter to identify the Scenario step by name, such as “CartView.” The value of this parameter matches the SmartSource Identification String specified when configuring the step. -
Step number
Use the
WT.si_xparameter identifies the position of the step, such as “2.” The numeric value of this parameter must match the order that you arrange them in the Ordered List of Steps list box. -
WT.si_cs
If you use Webtrends Visitor Data Mart, you can use this parameter to identify the page that you consider the conversion step, typically the last step in your scenario.
Scenario Analysis Tagging Example
Suppose you are using the Shopping Cart Scenario Funnel and you want to identify your thank you page as the conversion page. To incorporate this information in the Webtrends Shopping Cart Scenario Analysis, you need to set the following parameters: WT.si_n, either WT.si_p or WT.si_x, and for Visitor Data Mart users, WT.si_cs. You can use either WT.si_x to represent the step number or WT.si_p to identify the step position.
In this example use the following META tags on the Web pages for the conversion page:
<META NAME="WT.si_n" CONTENT="ShoppingCart">
<META NAME="WT.si_p" CONTENT="CartComplete">
<META NAME="WT.si_cs" CONTENT="1">
Alternatively, if you are configuring Scenario Analysis for Webtrends Analytics software, your content management system can directly assign values to the parameters as shown here:
WT.si_n=ShoppingCart
WT.si_p=CartComplete
WT.si_cs=1
Either approach results in the following query parameter definitions:
&WT.si_n=ShoppingCart&WT.si_p=CartComplete&WT.si_cs=1
Configuring Scenario Analysis By Specifying URLs
Use these instructions to configure Scenario Analysis by specifying the URLs of the pages you want to track. If you use Webtrends Analytics software, but do not use SmartSource tags to configure Webtrends, you can use this method to track scenarios. Alternatively, you can configure Scenario Analysis using SmartSource tags, which is the best practice for those using Webtrends Analytics On Demand. For more information, see “Configuring Scenario Analysis Using SmartSource Tags,” above.
To create a Scenario Analysis definition:
-
In the left pane, click Administration > Web Analysis > Report Configuration > Scenario Analysis.
-
Click New.
-
In the Name text box, type the name to identify this Scenario in the Administration interface.
-
Leave the SmartSource Identification String text box clear.
-
Type a title for this definition in the Report Title text box. When you add or edit a template, the report title identifies the scenario in the list of available reports.
-
In the Short Description text box, type an informative description for report users.
-
In the Help Card text box, provide explanatory information for report users. This information is included in the Help Card section of the report.
-
Clear the Use SmartSource tags exclusively check box.
-
Click Add to configure each step in the scenario. For more information, see “To configure Scenario steps,” below.
-
Use the arrows in the Ordered List of Steps list to arrange the steps in the order that visitors encounter them.
-
Click Save.
To configure Scenario steps:
-
In the Name text box, type a name to uniquely identify the step.
-
Leave the SmartSource Identification String text box clear.
-
In the Report Name text box, type a name that identifies the step in reports.
-
In the Help Card text box, provide explanatory information for this step.
-
Click Next.
-
In the Page Expression text box, type the URL of the page to track for this step.
-
If you want to treat the Page Expression text box as a regular expression, select the Regular Expression check box. Otherwise, leave the check box unselected.
-
If your web site content is delivered using dynamic pages, click New to specify the parameters that define this step.
-
Click Save.
Including Scenarios in Reports
To include a Scenario Analysis definition in a report:
-
Edit the profile that contains web data applicable to this Scenario.
-
If you are editing a profile, click Advanced> Scenario Analysis.
-
Select the check box for the scenario that you want to use.
-
Click Save.