
Because Web activity log files collect enormous amounts of data, a vital part of Webtrends analysis is deciding what data to keep and what data to discard. One of the guidelines Webtrends uses to determine how much data is included in analysis and reports is table limits. This article:
- Describes how Webtrends uses table limits
- Gives an overview of problems that can indicate some tables are reaching their limits
- Provides information about how to determine which tables might be causing problems
- Provides some examples of how to troubleshoot problems caused by oversized report tables
How and When Are Tables Limited?
Webtrends limits tables in two ways: it limits analysis tables during analysis, and it limits report tables after Web activity data has been analyzed, but before the report tables are written to the On Demand report database. This sequence is shown in the following graphic:
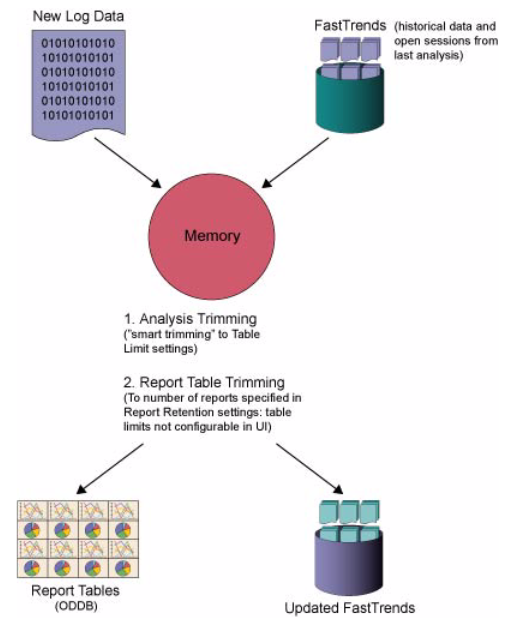
You can specify limits for both report and analysis tables for all reports (whether preconfigured or user-created).
Smart Limiting
During analysis, Webtrends uses an algorithm based on the age, frequency, and relevance of Web activity data when deciding which records to include. Smart limiting means Webtrends collects the most significant data and aggregates records with low relevance. However, there are some exceptions to smart limiting. For example, when reports use more than one dimension, only the second dimension uses smart limiting.
What Conditions Can Indicate Problems with Table Limits?
Typically, table limiting problems manifest themselves in one of two ways: slowed Webtrends performance due to insufficient system resources, or missing items in reports. As of Webtrends v7.5, reports also provide a message indicating when analysis or report tables have been trimmed to maintain table limits.
Memory and Performance Problems
Very large analysis tables can cause performance degradation. The scope of this problem is not necessarily limited to the adjustment of table limits. It can also be a function of your Web activity data and your report structure.
Missing Items in Reports
If significant items that you know were logged do not show up in reports, your table limits may be causing Webtrends to trim significant data. For example, you create a report using Pages as the primary dimension and Geographical Drilldown as the secondary dimension. When looking at daily reports, you see data for several regions that do not appear in the weekly reports. This scenario probably indicates that your weekly reports have reached their limits, and the missing regions have been rolled up in aggregate data. When you consider the combination of dimensions in this report, you can see that each one has the potential to contain many unique items, creating the possibility of very large reports. When Webtrends limits the tables for these reports, some unique items become part of aggregate data and are not shown individually.
What Factors Make Tables Fill Up, and How Can I Address Them?
As shown in the diagram in the section "How and When Are Tables Limited?" table limiting provides a reasonable way to limit the huge amount of data generated by Web activity files while still collecting meaningful data. However, depending on the kind of data you have and the kinds of reports you want to create, you may need to adjust table limits upward or consider modifying your reporting strategy to create reports that result in smaller tables.
How Tables Fill Up
The main factor that causes tables to reach their limits is large numbers of unique elements for a report dimension. You can use this expectation to detect problems with the JavaScript code-if the Java Support report collects more than two different values, the tracking code may have been modified or corrupted. For example, the JavaSupport table has only two possible unique elements: enabled and disabled. Even with the default limit of 10 elements, this table will never reach its limit. The TopVisitors table, however, will contain as many unique elements as there are unique visitors. Each of these elements requires an entry in the table. If you do not limit the table, performance can be affected.
In many cases, the number of possible values for a given dimension also depends on the Web site. Some sites have a very limited number of pages, but many unique visitors. A knowledge base site that stores each article on a separate page, however, may generate a very large number of page views even given a relatively small number of visits or visitors.
Webtrends provides several ways of limiting the number of unique elements analyzed. One powerful way of limiting unique elements is using filters at either the profile or the custom report level to include or exclude data. Another possibility is to use URL Rebuilding to modify URLs containing non-significant parameters so that fewer unique URLs need to be analyzed.
Combining Report Dimensions
In a two-dimensional report, the number of unique elements for both the first and second dimensions comes into play. To assess potential table sizes, multiply the number of possible unique values for the primary dimension by the possible unique values for the second dimension. For example, a report where Pages is the primary dimension and Visitors is the secondary dimension has the potential to generate a huge number of unique elements. A Web site with 200 unique pages and 5000 visitors could yield 1,000,000 unique elements.
For custom reports with two dimensions, you can limit these combinations by specifying analysis and report limits for both the Primary and Secondary dimensions. For the Secondary dimension, you can limit the total number of Secondary Dimension elements Webtrends analyzes, the number of elements analyzed per Primary Dimension element, or both.
For example, if you select Campaign IDs as the Primary Dimension and you limit the number of Secondary Dimension values per dimension to 10,000 elements, Webtrends can analyze 10,000 Secondary Dimension values for each campaign. If you then specify an overall Secondary Dimension limit of 30,000 elements, Webtrends stops after analyzing 30,000 elements, and further data about Secondary Dimensions is reported only in aggregate. Even if there are seven campaigns and only the Secondary elements for the first three are included in the analysis tables, further data collected for that analysis is not reported individually.
You can use limits to keep report tables in check and maximize performance when creating 2-dimensional reports, or you can expand your table limits to maximize the unique data you can collect, while keeping in mind that performance may be a problem. However, some combinations of dimensions, like Pages by Visits reports, simply generate too many unique elements for you to preserve a reasonable balance of meaningful data and manageable performance. One alternative approach for this particular combination is to create Content Groups to isolate smaller groups of pages, and then use Content Groups as a dimension instead of all Pages. If you use this method, keep in mind that the product of your expected visits and the number of Content Groups can still be very large.
Drilldowns
Drilldown reports present some additional issues with data sizing. When you create a drilldown dimension, you are factorially combining the elements for several unique dimensions. Depending on the structure of your data, this means unique elements can add up very quickly. You can limit the tables for a drilldown by limiting the overall number of elements for the drilldown, the number of elements in each level of the drilldown, or both.
You can also minimize the amount of accumulated data in drilldowns by keeping in mind the following guidelines.
Hierarchical Drilldowns
In a hierarchical drilldown, there is a many-to-one relationship between dimensions in the drilldown as you move from a higher to a lower level. In a drilldown where this is the case, you can assess table size by adding all the elements at the lowest level of the hierarchy. For example, the Products drilldown reports the following levels:
- Product Group
- Product Family
- Product Category
- Product Sub-Category
- Product Name
- Product SKU
Each Product Group contains multiple Product Families: each Product Family contains multiple Product Categories; and so on. Because the numbers become larger as you move down the levels, meaningful categories are less likely to be trimmed from the report table.
Non-Hierarchical Drilldowns
In contrast, if the top levels of your drilldown contain dimensions that can contain many possible elements, or if different elements at the same level contain the same sub-elements, your tables will fill more quickly and meaningful categories are more likely to be trimmed from your reports. You can assess the table size for non-hierarchical drilldowns by multiplying the possible elements in each level, which can yield much higher numbers of elements than in a hierarchical drilldown.
For a drilldown where the top levels contain hundreds of possible items, most of the overall table space will be filled by the first few thousand significant items if you use the default limits. Alternately, if you choose not to limit tables, you may need to allocate an unreasonable amount of memory to analysis. Even so, you may not have enough memory to process the profile.
Your tables will also fill up more quickly if the structure of your data is non-hierarchical, so that the same subcategories can be found in more than one branch at the same level. For example, suppose the Product Categories level of your Product drilldown contains the subcategories DVDs and Home Video. If each DVD you sell belongs to both the DVD subcategory and to the Home Video category, you will generate more unique elements because each combination of subcategory and item constitutes a unique element.
You can, of course, increase table limits. However, if you find that performance becomes a problem, another approach is to divide your drilldowns into smaller drilldown reports that contain only two or three dimensions. You can also create segments of your drilldowns as 2-dimensional custom reports.
When Are Analysis and Report Tables Cleared?
Analysis and report tables are cleared after all the periods for report analysis (such as daily, weekly, or monthly) are closed out, at which point the data resides only in the report database. (Report periods are defined on the Reports dialog of the profile settings.) For example, say a profile only uses weekly periods. When all the daily data is collected for a week, the weekly table can be closed out and cleared because all the data it contained is now stored in the report database, which is also known as the On Demand Database (ODDB). Regardless of what periods you select, all analysis and report tables are closed out and cleared at the end of the year.
The data in the On Demand Database is stored indefinitely unless you enable the Report Data Retention job. This job trims report databases using the settings specified in the Report Retention dialog. To access the Report Database dialog, pane, click Administration > Application Settings > System Management > Retention > Report. To enable the Report Data Retention job, click Scheduler > Scheduled Jobs, edit the Report Data Retention job, and clear the Disable this job? check box on the General dialog. The report database is trimmed when the job runs each day.
How Can I Investigate Table Activity?
To see a summary of report table limits and current table activity for the profiles with the most activity, use the View Table Sizes view of the Most Active Profiles dialog. This view provides information about the first-dimension and (where relevant) the second-dimension limits for each report table (custom and standard) as well as how many items each table currently contains. This information can help you identify tables that are at or near their limits.
To access the Most Active Profiles dialog:
- In the left pane, click Administration > Application Settings > Monitoring > Profiles >Most Active Profiles.
- Mouse over a profile and click View Table Sizes on the Action menu to show details for the profile you want to investigate.
To view table sizes for an individual profile:
- In the left pane, click Administration > Web Analysis > Reports & Profiles.
- Click Analysis > Table Sizes.
How Are Table Limits Configured?
You can configure the analysis and report table limits for custom reports by applying a default setting to all profiles, or you can specify a limit for non-custom reports at the profile level. The following sections describe the location of these settings in Webtrends Administration.
To configure default table sizes for reports:
- In the left pane, click Administration > Web Analysis >Options > Analysis.
- Click the Table Sizes dialog.
To configure table limits for an individual profile:
- Edit a profile.
- Click Analysis > Table Sizes.
Managing Pages Reporting
Because reports that rely on the Pages table are especially likely to have many unique items, table limiting is a special concern for these reports. If your Pages reports become very large, you may need to change your configuration to use these reports more effectively.
The following reports rely on the Pages table:
- Pages
- Single Level Paths - Forward
- Single Level Paths - Reverse
- Single Level Paths - Forward and Reverse
- Paths - Forward and Reverse Reports
- Top Entry Pages
- Top Exit Pages
- Any custom report based on a dimension using Pages
We recommend monitoring table activity for these reports as described in the following troubleshooting instructions. Keep in mind that if you use Webtrends On Demand, you cannot adjust table limits. Contact your account representative if you believe you are experiencing a problem that requires changing table limits.
To troubleshoot Pages reporting:
-
To determine whether your Pages reports are reaching their limits, or if you suspect unique URLs are not being collected and added to your reports, use Profile Monitoring to check your table activity. For more information, see “How Can I Investigate Table Activity?” above.
-
If the Pages table is nearing or has reached its limit, consider raising the table limits. For more information about adjusting your table limits, see “How Are Table Limits Configured?” above.
-
If your Pages table is very large, you may find that raising the table limit slows performance to an unacceptable level or causes Webtrends Analytics to fail. If this occurs, make sure your installation is configured for best performance and minimal resource consumption. For example:
- Make sure your profile does not include a large number of reports, especially other resource-intensive reports. Disable any reports you do not need. If necessary, you can create a separate profile for Pages reports.
- Make sure you have enough physical and virtual memory to support your installation. See the Release Notes for sizing considerations.
- Try disabling resource-intensive features such as Visitor History collection and interval data, which are not required for Pages reports.
- Disable page title lookups in your profile. If you tag your pages using Webtrends query parameters for Webtrends Analytics On Demand or SmartSource Data Collector, be sure you use the
WT.tiquery parameter to identify page titles.
-
Try using the URL Rebuilding feature to reduce the number of unique pages. URL Rebuilding allows you to decide which URL parameters should be included in page URLs that are collected in the Pages table. For example, if every URL contains a unique session ID, hits to the same page will be counted as different pages and inflate the number of pages in the Pages table. For more information about using URL Rebuilding to reduce your Pages count, see “Using URL Rebuilding.”
Keep in mind that you can still report on a URL parameter even if you exclude it from the Pages reports using URL Rebuilding. For example, if you remove a parameter that indicates the product ID from the Pages report, you can still report on the parameter using URL Parameter Analysis, and you can still use the standard Products reports with a translation file. If you are licensed to create custom reports, you can also build a custom report that shows a complete list of product IDs.
-
If you have problems with too many unique URLs that are not caused by URL parameters, you may want to try using URL Search and Replace to remove unique strings. For more information, see “Using URL Search and Replace.”