About the Data Extraction API
- 01 Apr 2024
- 1 Minute to read
- Contributors


- Print
- DarkLight
- PDF
About the Data Extraction API
- Updated on 01 Apr 2024
- 1 Minute to read
- Contributors
- Print
- DarkLight
- PDF
Article summary
Did you find this summary helpful?
Thank you for your feedback!
The Data Extraction API enables you to retrieve Webtrends Analytics 9 profile and report data, and monitor key metrics for profiles. The Data Extraction API conforms to the REST (Representational State Transfer) architectural style, using the HTTP protocol and a URI to access resources.
Benefits
- Integrates with Excel without coding, client software, or installed driver--you need only your Webtrends credentials to get data
- Is profile independent, so you can list multiple profiles by changing the profile name in the URI
- Provides macros that enable you to request data for “yesterday” or “this month”
- Supports JSON (JavaScript Object Notation), XML, HTML and CSV output of any object for use in Web 2.0 mashups, widgets and applications
- Enables creation of AJAX applications (or any other web interface for Webtrends data)
Data Extraction API vs. Analytics User Interface
The Data Extraction API exchanges and transfers stored data only, so the report data from it will not always match the data seen at the Analytics user interface, because some reports in Webtrends Analytics 9 may contain numbers resulting from rounding, limiting decimals, or averaging subtotals. Data Extraction API report data does not include averages (unless they are a measure of actual analyzed data - see Note below), subtotals or other values sometimes shown in the Analytics user interface, specifically:
- Averages and percentages for measures in drill-down reports -- these are shown in the user interface so measures are not blank when the drill-down is collapsed. These are excluded from Data Extraction API responses.
- Sortable "Measures" column -- this contains a calculation designated as an average that is not valid for comparison. This measure average is not equivalent to the actual measure (which may itself be designated as an average, for example, "Average Visits").
Note: An example of an average that is actual analyzed data returned by the Data Extraction API is a customer-created measure called “Average RSS Feed Subscriptions”. It is based on a parameter, and stored in the report table, as opposed to derived at display time.
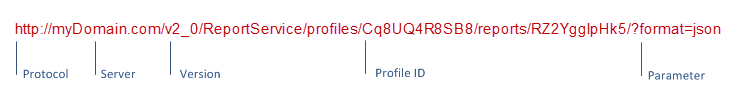
How does it work?
Version number
The version number you will use is dependant upon the version of Analytics you have installed. Analytics versions 9.5 and below, use v2_0. Analytics versions 9.5.1 and above will use v2_1.
You compose a URI to describe the data you want:
Was this article helpful?